Monitoring Your Experiment
Monitoring and analysis in FlagSync let you assess how feature flag variants perform during and after an experiment. By reviewing impressions, events, and metrics, teams can determine which variants optimize goals like conversions or user engagement, refining strategies with data-driven insights.Data Sources
Impressions
Automatically logged when client.flag() serves a variant.
e.g., tracking which users see “Join Now” or “Register”.
Events
Captured via client.track() in your code.
e.g., logging sign-ups or purchases tied to those variants.
Metrics
Aggregates impressions and events into conversion rates or numeric values for analysis.
e.g., average spend
Interpreting Results
Conversion Rate
Compare the percentage of users acting after seeing a flag variant (events ÷ impressions).
Numeric Metrics
Assess aggregated values per user—e.g., higher purchase amounts with a discount.
Use these insights to adopt the winning variant or inform the next experiment iteration.
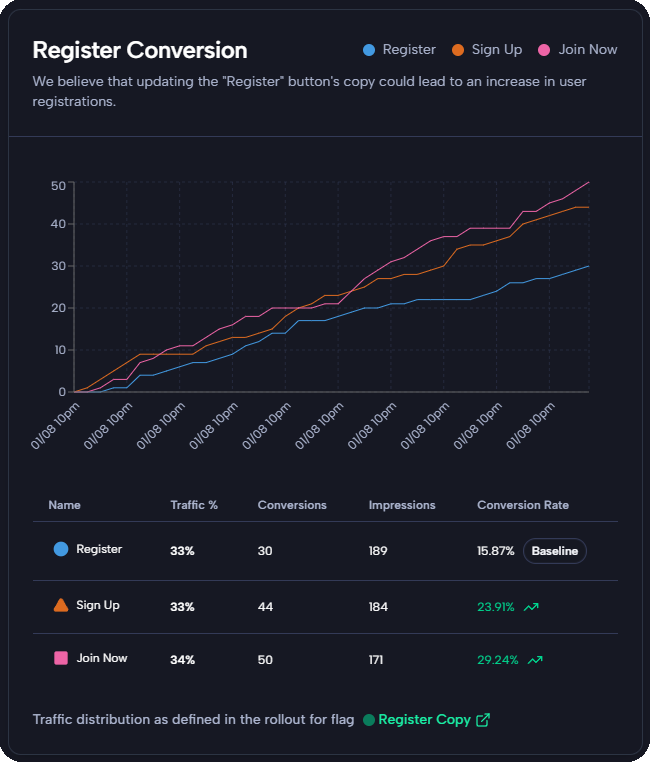
Real-World Example
Here’s how theRegister Conversion experiment plays out in a live FlagSync experiment, testing if new button copy increases sign-up conversions:
Accessing Experiment Data
- Live Monitoring: View real-time results on the Experiments Dashboard while the experiment runs.
- Past Iterations: For completed experiments, go to the specific experiment page and select the “Previous Iterations” tab to review historical data.
Next Steps
Decided on a winner?- Keep the top variant live in Feature Flags.
- Refine with a new experiment in Create an Experiment.