What Are Conversion Rate Metrics?
Conversion rate metrics measure the percentage of users who perform an action after seeing a flag variant—calculated as:signup-complete) follows a flag impression, revealing which variants drive behavior in Experiments.
Example: Sign-Up Conversion
Let’s explore how a conversion rate metric tracks sign-ups for thesignup-cta flag, testing which button text variant (Join Now, Register, or Sign Up) drives the most conversions:
Impression
Logs an impression each time the
flag() function gets the text variant:Event
Track the
signup-complete event when a user signs up:Experiment
- In an Experiment, FlagSync links these
signup-completeevents tosignup-ctaimpressions to calculate conversion rates. - If User ABC sees
Join Nowand later triggerssignup-complete, FlagSync records it as a successful conversion.
Timing matters: Only events tied to prior impressions count—FlagSync ensures the user saw the variant before acting, ensuring accurate cause-and-effect.
Sample Conversion Results
Here’s a hypothetical outcome of thesignup-cta experiment, showing how many users sign up after seeing each variant (Join Now, Register, Sign Up) with 100 users per variant:
Insight: Join Now leads with 35%—it’s the most effective at driving sign-ups.
Example Dashboard Insights
See a simulated FlagSync dashboard for thesignup-cta experiment, testing how button copy variants (Join Now, Register, Sign Up) impact sign-up conversions over time:
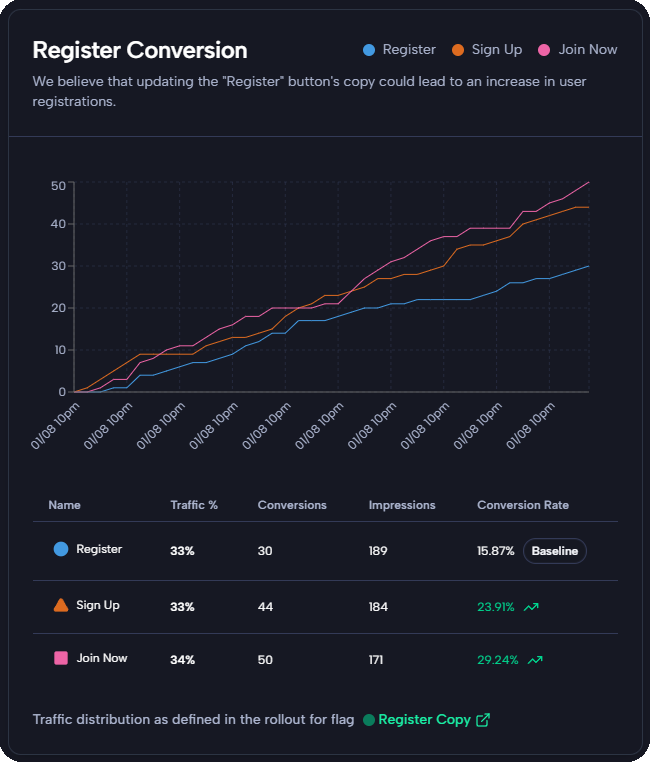
- Trend: The chart shows
Join Now(pink) leading over time, followed bySign Up(orange), withRegister(blue) trailing—confirming our example’s insight.
Next Steps
- Track events in Quickstart: Send Events.
- Define metrics in Quickstart: Define Metrics.
- Test in Quickstart: Create an Experiment.
- Explore Numeric Metrics.