Examples
For adiscount-rate flag with variants 0%, 20%, and 30%, impressions are logged when users see the applied discount, and events are tracked when they complete a purchase.
Average or Sum Purchase Price
Let’s explore how an average or sum metric tracks purchase value for thediscount-rate flag, testing which variant drives higher spending:
1
Set It Up
Select 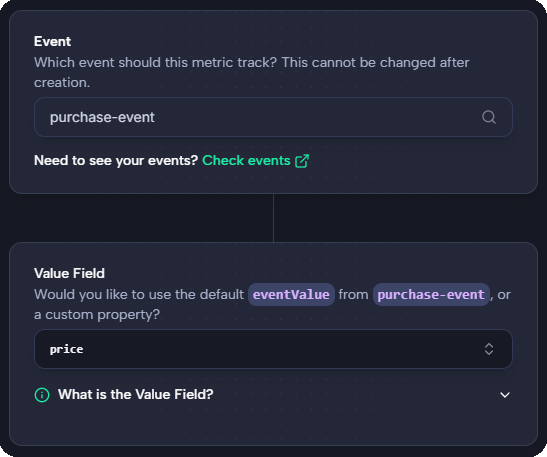
purchase_event and enter price as the value field to aggregate:2
Choose Aggregation Method
Aggregate by average or sum: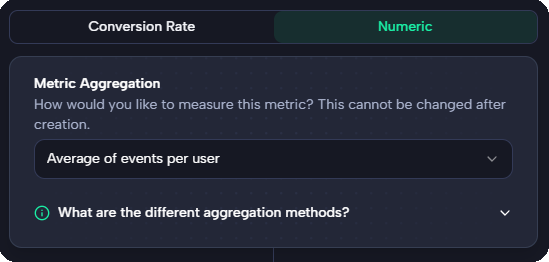
3
Interpret Experiment Results
See a simulated FlagSync dashboard for the 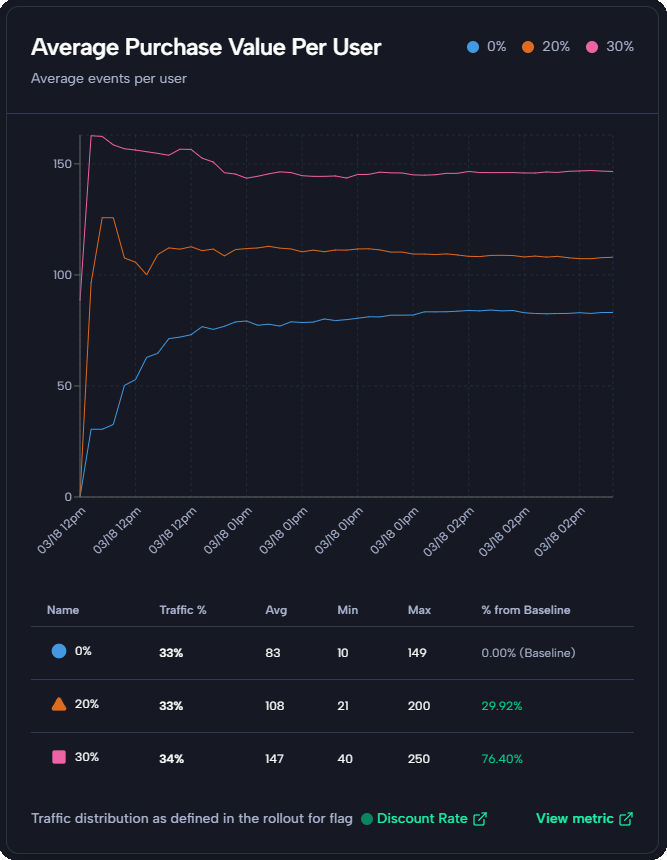
discount-rate experiment, testing how discount variants impact average purchase value:- Trend: The chart shows 30% (pink) leading at $147 average purchase value, followed by 20% (orange) at $108, with 0% (blue) at $83.
The 30% variant is the clear winner, increasing average purchase value by 76.4% over the baseline.
Next Steps
- Learn concepts in Numeric Metrics: Overview.
- Explore Experiments.