Defining Metrics
Metrics track how features affect users—like clicks or sign-ups—by correlating events and flag impressions from users. Let’s create two:Sign-Up CTA Click(sign-up clicks within the layout).Sign-Up Complete(completed sign-ups).
new-feature flag (Enabled/Disabled) to test if the new layout boosts conversions.
1
Add a Metrics
In the Dashboard, click ”+” next to Metrics or go to Create a Metric.
2
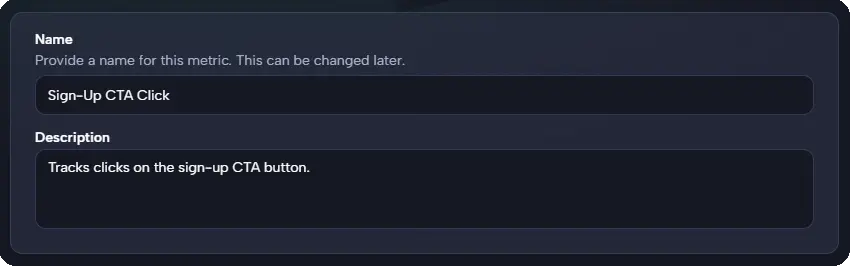
Name Your Metric
- Name: Enter
Sign-Up CTA Click. - Description (optional): Add “Tracks clicks on the sign-up CTA button.”
3
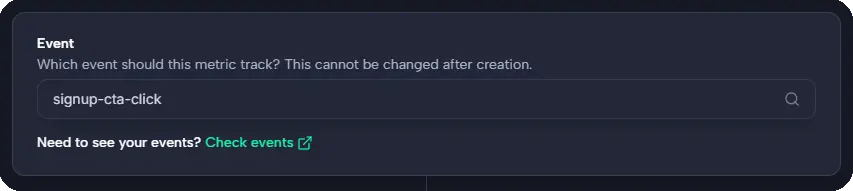
Pick Events
- Select
signup-cta-clickfrom the dropdown.
- This auto-populates from SDK calls like:
4
Choose Measurement Type
Select “Conversion Rate”.
Measures click events vs. impressions (e.g., 100 clicks / 1,000 views = 10%)
5
Choose Impact
Select “Increase”.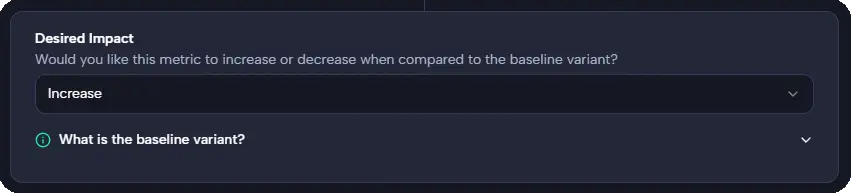
We want more clicks compared to the baseline (Register).
6
Save It
Click “Create Metric” to save.
7
Repeat
Repeat the process for the
Sign-Up Complete metric:- Name: Enter
Sign-Up Complete. - Description (optional): Add “Tracks sign-up completion.”
- Select Event:
signup-complete - Type: Conversion Rate
- Impact: Increase
Next Steps
Metrics are set—now use them:- Test variants in Quickstart: Create an Experiment.
- Check results in Monitoring and Analysis.
- Learn more in Metrics.